Analysis
AGI is almost here. What does YC actually fund in 2026?
Everyone quotes the Requests for Startups. Almost nobody counts the batch. So I took all 6,215 publicly listed Y Combinator companies, turned each one into a vector on my own machine, and asked the duller question: what is actually in there — and for how long has it been?
The snapshot is easy and mostly useless. Robotics is up 2.8× on its historical weight, consumer has collapsed, everything says AI. You could have guessed two of those three.
The trajectory is the part worth having, and it disagrees with the snapshot in three places. A YC batch has lost roughly half its variety since 2016. The agent wave is not receding — its share fell while its count rose. And the single fastest-climbing activity in the 2026 batch is one of the worst-resolving activities in YC's own mature history.
None of that is advice. The last section explains, at some length, exactly why this data cannot give any.
How the measurement works
The snapshot is the YC-OSS community mirror of YC's public company directory, taken on 14 September 2026: 6,215 companies. It is not an official YC API.
Each company's description, tags and sector go through
paraphrase-multilingual-MiniLM-L12-v2, a 384-dimension sentence embedding
model, running on CPU through fastembed. Nothing is sent anywhere; no embedding API is
called. Names, dates and outcome-flavoured marketing phrases are stripped first, so the
vector describes what a company does rather than how well it did. KMeans then
splits the space into 32 activity clusters. You can
open the map and
download the whole thing.
The 2026 cohort is the 678 companies with a batch year of 2026 or later — Winter 2026 (199), Spring 2026 (193), Summer 2026 (234), Fall 2026 (51), plus one Winter 2027 entry already listed. Per-year tables use year = 2026 exactly (677). Fall 2026 is a partially collected batch, not a small one — 51 against 193–234 for the other three. Every claim below that could be distorted by it says so.
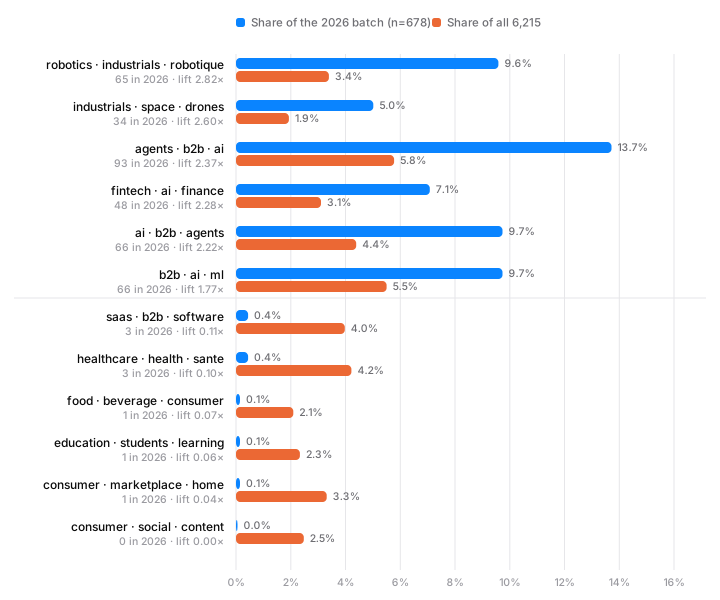
Lift means: this activity's share of a cohort divided by its share of all 6,215. Lift 2.0 = twice as concentrated as in YC's history. Parity is lift 1.0.
1. A batch is half as varied as it was
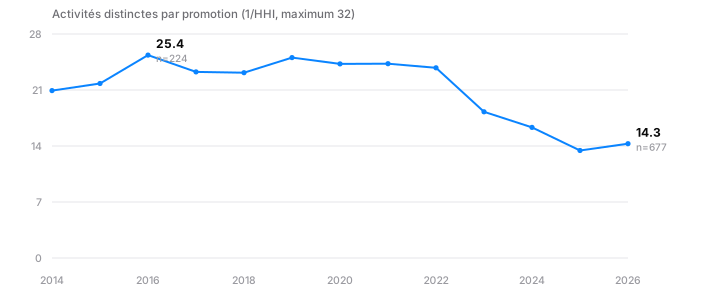
"Everything is AI now" is an impression. Here is the number behind it. Squaring each activity's share of a batch and inverting the sum gives the effective number of activities — how many distinct things a batch is really spread across, out of 32.
tools/build-yc-trajectory.php.
A 2016 batch was spread across the equivalent of 25.4 distinct activities (n=224). A 2025 batch: 13.4 (n=621). That is a 47% loss of variety, and it did not happen gradually — the series sits in the low twenties from 2016 to 2022 and then breaks, sharply, from 2023.
Small batches concentrate for arithmetic reasons alone, so this could be an artefact of
batch size. It is not: resampling every year down to a fixed 51 companies, and again to
150, leaves the same shape — plateau, then break at 2023. The same collapse shows up on
the nine-value industry field, which owes nothing to my choice of 32 clusters.
The 2026 point is not a recovery. The chart ends at 14.3, above 2025's 13.4, and it would be easy to call that a rebound. It is one batch: remove Winter 2026 and the rest of the year sits at 13.5, indistinguishable from 2025. With Fall 2026 only partly collected, the honest reading of the last point is "no change", not "up".
2. "AI" stopped being the thing you say
Four fifths of the 2026 cohort — 536 of 678, 79.1% — mention AI, an LLM, an agent or a model. In 2020–2023 it was 38.3%. When 79% of a batch matches your filter, your filter is off. The movement is inside the word:
| Cohort | n | says "AI" | says "LLM" | says "agent" |
|---|---|---|---|---|
| 2020–2023 | 2,289 | 33.0% | 2.5% | 10.9% |
| 2024–2025 | 1,211 | 69.0% | 4.0% | 34.8% |
| 2026 | 678 | 63.9% | 2.7% | 40.0% |
"AI" is saturated — 69.0% in 2024–2025, 63.9% in 2026 — because saying it no longer distinguishes you from the company next door. "LLM" sits at 2.7%, below where it was in 2020–2023. And "agent" went from 10.9% to 40.0%, the largest move of the three by a wide margin.
The model became infrastructure. You do not pitch the electricity, you pitch the appliance.
One honest caveat on that 40%: the pattern also catches insurance agents and real-estate agents. Spot checks say the 2026 hits are overwhelmingly AI agents, but treat it as a ceiling.
3. Four trajectories, same axis
A lift figure is a photograph. These are the films. Same vertical scale on all four panels; the dashed line is that activity's share of the whole portfolio, so above the line means over-weighted.
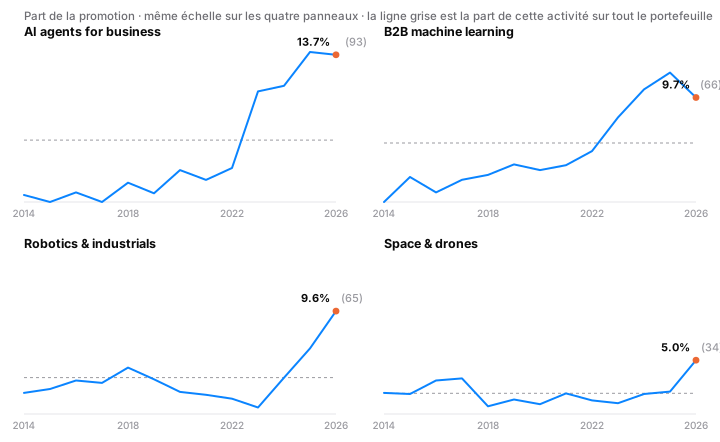
AI agents for business is flat, not falling. 14.8% of the 2025 batch, 13.7% of 2026. It is tempting to read that as a wave receding. It is not: the 2025 batch contained 92 of these companies and the 2026 cohort contains 93. The share fell because the batch grew, not because the activity shrank. On a one-point, 1.1-point move this is "flat at a high level" and nothing more.
B2B machine learning did turn down: 12.1% (75 companies) in 2025 to 9.7% (66) in 2026, the largest share decline of any activity this year. Two neighbouring AI clusters, two different shapes — which is the argument for looking at trajectories rather than at a single "AI" bucket.
Robotics is the steepest climb in the dataset, and it starts from a floor. In 2023 it was 0.6% of the batch — three companies, against a portfolio average of 3.4%. Then 3.4% (20 companies) in 2024, 6.1% (38) in 2025, 9.6% (65) in 2026. Three consecutive rises, tripling off a base so low that the depth of the 2023 trough rests on three companies and should be treated as thinly measured. The climb after it does not: 20, 38, 65 are real numbers.
Space and drones is the late mover. For a decade it never exceeded 3.3% of a batch and mostly sat near the 1.9% portfolio average. In 2026 it is 5.0% — 34 companies, up from 13. It is the only activity in the dataset whose 2026 lift exceeds 2.0 without having been elevated in either 2024 or 2025.
4. The money walked out of the browser
tools/build-yc-chart.php, which refuses to write
the file if the shares do not sum to 100%.
The industry label agrees with the clusters: Industrials is 18.0% of the 2026 cohort against 7.5% of all time. Nearly one in five new YC companies now builds something that has mass. At tag level the same story — Semiconductors 4.58×, Reinforcement Learning 3.84×, Defense 3.48×, Robotics 2.77×, Hard Tech 2.56×. (Those are the top lifts among tags applied to at least five 2026 companies; below that threshold a tag can show 9× off a single company, which measures nothing.)
The names read like a different accelerator than the one that funded Dropbox. OS3 — "affordable, intelligent humanoid robots built to deploy at scale". Tensr — "robotic factories that build robots". Beyond Reach Labs — "space solar arrays that grow to the size of a football field in orbit". Baud — "AI chips for ultra-fast training and inference".
5. The loudest signal is a disappearance
YC's Fall 2026 Requests for Startups gives one of its thirteen entries to "AI-Powered Consumer Products for 1 Billion People". Here is what the batch did with that invitation.
Consumer collapsed: 5.5% of the 2026 cohort against 14.2% of all time, lift 0.38×. Underneath the average it is worse than a decline. The cluster whose terms are consumer · social · content has zero companies in the 2026 cohort, out of 678 — against 154 across the portfolio. Consumer marketplaces: one, against 206. Food and beverage: one, against 130. Apparel: two, against 76. Three of the five lowest-lift clusters in the dataset are consumer clusters.
Education went the same way. The RFS opens with "The Primer" — the personalised tutor from The Diamond Age. The 2026 cohort contains one education company: 0.15% against 2.0% historically, lift 0.07×.
The two categories YC is most publicly enthusiastic about are the two the batch is emptiest of. That gap is the finding — and it is worth being careful about what it does not say. These are accepted companies only. A lift of 0.07× may mean founders stopped applying, or it may mean YC kept saying no. The public directory cannot separate those two, and neither can anyone else working from it.
6. What outcomes say, and the clock that drowns them
The obvious next question is whether any of this works. The data answers it badly, and the way it fails is worth more than the answer.
Take only companies from 2019 or earlier — 2,036 of them, with six-plus years of observation. 27.1% are marked Acquired or Public. Call that the base rate. Now look at the same rate by batch year across the whole corpus:
| Batch year | n | Acquired or Public |
|---|---|---|
| 2012 | 149 | 32.9% |
| 2014 | 152 | 37.5% |
| 2016 | 224 | 21.4% |
| 2019 | 370 | 15.7% |
| 2021 | 727 | 11.0% |
| 2023 | 494 | 10.5% |
| 2025 | 621 | 1.6% |
| 2026 | 677 | 0.0% |
That is a clock, not a quality signal. A 2012 company has had fourteen years to be acquired; a 2023 company has had two. Any sector table computed on the full corpus is mostly a readout of that sector's average founding date. It is the single most common way to be wrong with this dataset, and it is why everything below is restricted to the mature cohort.
Within those 2,036 mature companies, activity does relate to outcome — coarsely. Against the 27.1% base: data and analytics resolves at 45.8% (n=72), B2B tooling at 42.1% (n=57), B2B SaaS at 38.7% (n=111). At the other end, consumer marketplaces 10.7% (n=56), logistics 12.5% (n=40), robotics 14.8% (n=54). A chi-square across all 32 clusters gives 83.5 on 31 degrees of freedom — the spread is not chance, and it survives age-standardisation.
But it is three bands, not a league table. Of the 496 possible pairs of clusters, 459 have overlapping 95% confidence intervals. You can say "B2B tooling has historically resolved better than consumer hardware". You cannot rank two mid-table sectors against each other, and any chart that prints 32 sorted rows is lying by layout. I have not drawn one.
Which leaves one sentence that survives every check, and it is the most useful one here: robotics is the fastest-climbing activity in the 2026 batch and, in the mature cohort, resolves at 14.8% against a 27.1% base — roughly half, on 54 companies. That is a tension between what is being funded now and what has historically resolved. It is not a prediction. The robotics being funded in 2026 is not the robotics of 2015, the sample is 54 companies, and "resolved" here means a directory flag, not a return.
7. The Requests for Startups, scored against the batch
The Fall 2026 edition lists thirteen requests. Each against what is actually in the cohort, read off the page itself on 20 September 2026:
| Request | What the batch says |
|---|---|
| New Operating Systems for the Physical World | Confirmed — robotics 2.82×, space & drones 2.60×, Industrials 2.41×, Hard Tech 2.56× |
| The Future of American Defense | Confirmed, small base — 11 companies tagged Defense against 29 all-time, lift 3.48× |
| AI-Powered Consumer Products for 1 Billion People | Contradicted — Consumer 0.38×; the consumer·social·content cluster is 0 of 678 |
| The Primer | Contradicted — 1 education company, lift 0.07×; 2 by tag against 164 all-time |
| The Best Time to Build in Crypto | Contradicted — 5 tagged Crypto/Web3 against 94 all-time, lift 0.49× |
| AI-Native Compliance Infrastructure | Contradicted — 4 tagged Compliance against 74 all-time, lift 0.50× |
| Multiplayer AI | No tag exists for it. The nearest historical proxy, Collaboration, is 0 in 2026 against 44 all-time — suggestive, not conclusive |
| Data for the Real World | Ambiguous — the data·analytics cluster is down at 0.72×, while physical-world sensing is the fastest-growing thing in the batch |
| Self-Maintaining APIs | Ambiguous — Developer Tools at 0.70×, but no tag isolates the idea |
| A Cloud for Small Software | Not measurable — no tag or cluster maps to it; open-source infrastructure sits at 0.90× |
| Compute at Sea | Not measurable — nothing in the schema corresponds |
| AI for the Aging Population | Not measurable — there is no aging or elder-care tag anywhere in 6,215 companies |
| Proving You're Human | Not measurable — Identity is 1 of 16 all-time; Trust & Safety has 3 companies in the whole dataset |
Two confirmed, five contradicted or near it, six the data cannot speak to. That is not an accusation of bad faith: an RFS is an invitation, not a commitment, YC says as much in its own introduction, and it runs ahead of the portfolio by design — these four batches closed before the page I read was written. But the essay and the batch are two different documents. One is a wishlist. The other is a record of decisions.
What this cannot tell you
If you plan to use any of this, read this section first. It is longer than the findings for a reason.
- This is not investment advice, and the data cannot produce any. There is no revenue, no valuation, no round size, no ownership and no return anywhere in it. Batch composition tells you what an accelerator admitted. It tells you nothing about entry price, dilution, or what a fund of any vintage holds. I have deliberately left out every "you are early / you are late / it is already priced" sentence that the numbers seemed to invite, because not one of them is supported.
- Accepted companies only. Rejected applications are not public. A lift of 0.07× cannot distinguish "founders stopped applying" from "YC kept saying no".
- The source is a community mirror, not YC. Every figure describes the public directory as YC-OSS mirrored it at 06:05 UTC on 14 September 2026. Companies that are private, withdrawn or never listed are invisible.
- Descriptions are present tense. They are today's text, after any pivot. This measures what each cohort says it is now, not what it pitched at admission.
- Clusters do not move. Each company carries one KMeans label, assigned once. When two clusters move in opposite directions I can show you both lines; I cannot show you a company travelling between them, and no sentence here claims one did.
- "Resolved" is a directory flag. Acquired includes acqui-hires. Inactive is not a loss figure. Of 815 acquisitions, 7 have a known price. Nothing here measures money.
- Fall 2026 is partially collected. 51 companies against 193–234 for its sibling batches. Any 2026 reading is provisional, and the one place it would have changed a conclusion — the apparent variety rebound — is flagged where it occurs.
- Small moves are not trends. A one-point change on a 600-company batch is about six companies. Where a move is that size I have said "flat" and left it alone, including where a more dramatic word was available.
- 32 clusters is a choice. The number is a heuristic and the labels are the terms that dominate each group, not a taxonomy anyone agreed to. Where a finding matters, I have checked it against the nine-value industry field, which does not depend on that choice.
Do it yourself
Every number above comes out of one file, published beside this article, needing no key:
- The interactive atlas — all 6,215 companies on one map, filterable, with the five nearest neighbours of anything you click computed in the full 384 dimensions.
- The dataset — columnar JSON: coordinates, clusters, tags, neighbours, status, batch. 850 KB.
- The scripts —
tools/build-yc-data.phpbuilds the dataset,build-yc-chart.phpandbuild-yc-trajectory.phpdraw the three figures straight from it. Each asserts its own output before writing: shares must sum to 100%, the encoding must round-trip, the figure's box must match what this page reserves for it.
Every figure in this piece was recomputed independently before publication, and the first draft lost several conclusions to that check — a variety "rebound" that was one batch, an agent wave "receding" while its company count rose, and a page of investor-facing conclusions the data never supported. If you re-run it against a newer snapshot and get a different answer, I would like to know. That is the only reason the data sits next to the article.

Got a dataset worth pointing a model at?
hello@riazlab.com